Skip to content

Grade 10 · Core Mathematics · Lesson 8 of 16

Determining Mean, Mode, and Median of Grouped and Ungrouped Data

A Grade 10 Core Mathematics CBE lesson from the sub-strand Statistics I. In it, learners calculate the median of grouped data using the cumulative frequency interpolation formula.

Strand Statistics and ProbabilitySub-strand Statistics ILesson code 10CM-31-L840 minutes · 4 slides

KICD learning outcome (c)

Determine mean, mode and median of grouped and ungrouped data.

By the end of this lesson, learners should be able to

  1. Calculate the median of grouped data using the cumulative frequency interpolation formula.
  2. Determine missing frequencies in grouped distributions and compute the overall mean and median.
  3. Calculate the mean, modal class, and median from contextual grouped continuous datasets.
  4. Construct ungrouped frequency tables from raw continuous/discrete data to evaluate mean, mode, and median.

Key vocabulary

Lower class boundary
The exact lower dividing limit between consecutive class intervals in grouped data.
The class interval 300 to 399 has a lower class boundary of 299.5.
Interpolation formula
A mathematical rule estimating an intermediate value within a given continuous class interval.
We apply the interpolation formula to determine the median daily wage of workers.
Missing frequency
An unknown class frequency determined by subtracting known frequencies from total frequency.
We solved for the missing frequency k by setting the sum to 50.
Modal class
The class interval in a grouped distribution that has the highest frequency.
The class 35 to 39 kg is the modal class with fourteen learners.
Discrete frequency table
A table recording individual distinct values and how many times each value occurs.
We created a discrete frequency table for travel times of twenty learners.

Lesson preview

Slide 1 · Grouped Median using Cumulative Frequency FormulaOpening · 10 min
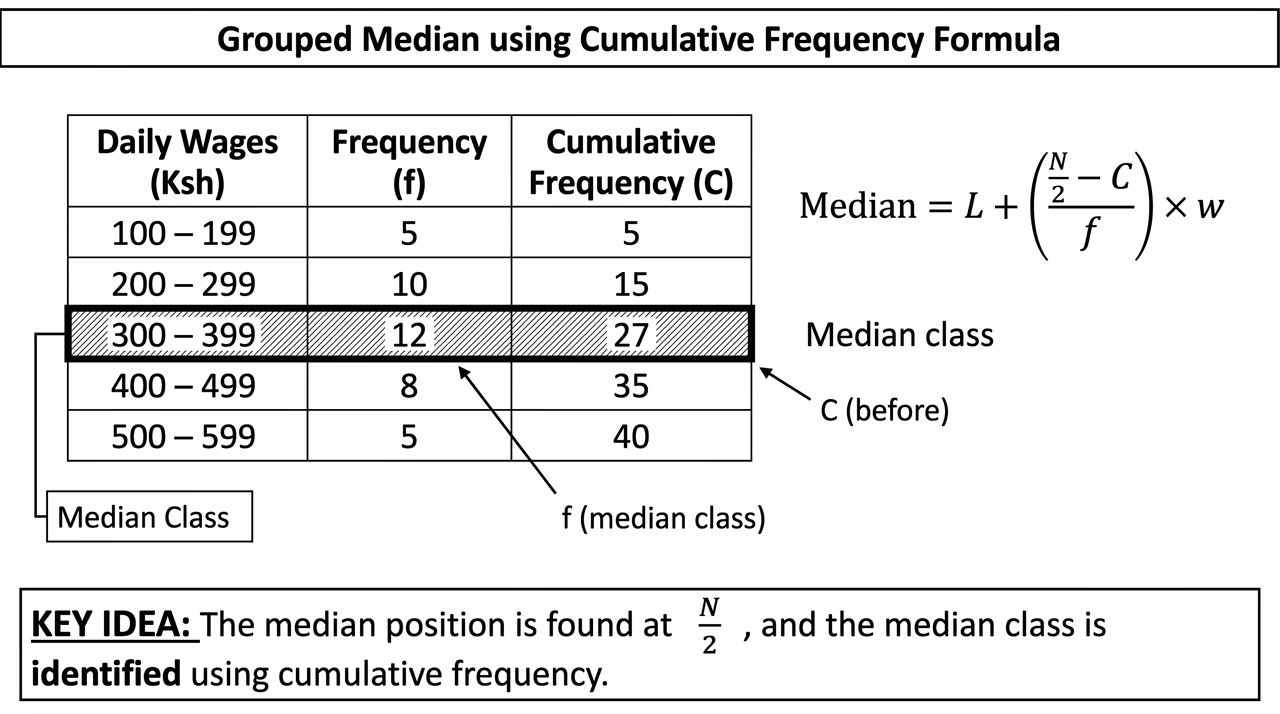
A frequency table showing daily wages alongside the grouped median formula, with the median class highlighted.
Figure 1: A frequency table showing daily wages alongside the grouped median formula, with the median class highlighted.

To find the median of grouped data, we locate the median position at N2 and identify the median class using cumulative frequency. We then apply the formula Median=L+(N2−Cf)×w, where L is the lower class boundary of the median class, C is the cumulative frequency before the median class, f is the frequency of the median class, and w is the class width. This formula interpolates the middle value within the class interval. Use Figure 1 to see how these formula parameters are identified in a table.

  • The median position is found by calculating half of the total frequency, N2.
  • Cumulative frequency identifies the class interval that contains the middle observation.
  • Lower class boundary L and class width w define the span of the median class.
  • The grouped median formula estimates the exact middle value through linear interpolation.
Worked example. Construct cumulative frequencies: 100–199 (C=4), 200–299 (C=12), 300–399 (C=23), 400–499 (C=30). Determine total frequency N=30 and median position N2=15. Identify median class 300–399, where cumulative frequency reaches 23. Extract parameters: L=299.5, C=12 (previous cumulative frequency), f=11, and w=100. Substitute into formula: Median=299.5+(15−1211)×100=299.5+27.27=326.77. Answer: Median daily wage = Ksh 326.77.

Check question: A daily wage distribution for 40 workers has median class 200–299 (L=199.5,f=10,w=100), N=40, and cumulative frequency before the median class C=14. Calculate the median wage.

  1. Ksh 259.50
  2. Ksh 260.00
  3. Ksh 459.50
  4. Ksh 200.10
Show answer

Ksh 259.50. Using the formula Median=L+(N2−Cf)×w, we first find N2=402=20. Substituting the values gives 199.5+(20−1410)×100=199.5+(610)×100=199.5+60=259.50.

Slide 2 · Finding Unknown Frequency and Evaluating Central TendencyModel · 10 min
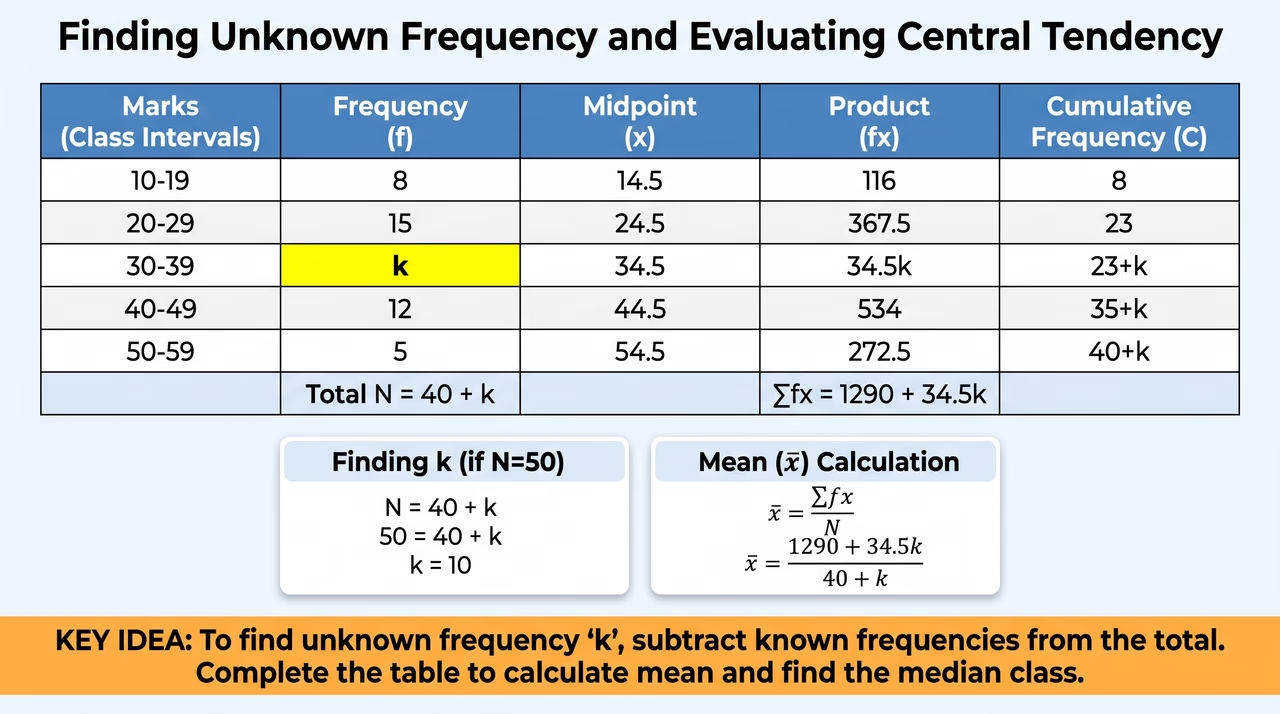
A frequency table containing an unknown frequency, displaying the steps to calculate the missing value and mean.
Figure 2: A frequency table containing an unknown frequency, displaying the steps to calculate the missing value and mean.

Teach the full lesson on the projector

This lesson, and every other Grade 1–10 CBE lesson, comes ready to project with the EAP ClassKit. It runs without electricity or internet.

  • All 4 slides with diagrams and class activities
  • Teacher notes, SNE adaptations and assessment checks
  • Homework and the other 15 lessons in this sub-strand

All 16 lessons in Statistics I

  1. 1Gathering Data from Practical SituationsCollect data from real-life sources
  2. 2Frequency Distribution Tables for Ungrouped and Grouped DataDraw a frequency distribution table for grouped and ungrouped data
  3. 3Drawing Grouped Frequency Distribution TablesDraw a frequency distribution table for grouped and ungrouped data
  4. 4Constructing Frequency Distribution Tables for Grouped and Ungrouped DataDraw a frequency distribution table for grouped and ungrouped data
  5. 5Calculating Averages and Middle Values of Raw DataDetermine mean, mode and median of grouped and ungrouped data
  6. 6Determining Median of Data and Introduction to Grouped Data MeanDetermine mean, mode and median of grouped and ungrouped data
  7. 7Determining Mean, Modal Class, and Median of Grouped DataDetermine mean, mode and median of grouped and ungrouped data
  8. 8Determining Mean, Mode, and Median of Grouped and Ungrouped DataDetermine mean, mode and median of grouped and ungrouped data
  9. 9Representing Data Using Histograms and Frequency PolygonsRepresent data using histograms and frequency polygons
  10. 10Constructing Histograms and Frequency PolygonsRepresent data using histograms and frequency polygons
  11. 11Advanced Data Representation: Histograms and Frequency PolygonsRepresent data using histograms and frequency polygons
  12. 12Interpreting Data from Histograms and Frequency PolygonsInterpret data from histograms and frequency polygons
  13. 13Interpreting Histograms and Frequency PolygonsInterpret data from histograms and frequency polygons
  14. 14Interpreting Histograms and Frequency PolygonsInterpret data from histograms and frequency polygons
  15. 15Data Collection, Organisation, and Informed Decision MakingPromote data collection, organisation and representation for informed decision making
  16. 16Data Interpretation and Decision MakingPromote data collection, organisation and representation for informed decision making