
Skip to content

Grade 10 · Core Mathematics · Lesson 1 of 16

Gathering Data from Practical Situations

A Grade 10 Core Mathematics CBE lesson from the sub-strand Statistics I. In it, learners define data as facts gathered in quantitative or descriptive formats.

Strand Statistics and ProbabilitySub-strand Statistics ILesson code 10CM-31-L140 minutes · 2 slides

KICD learning outcome (a)

Collect data from real-life sources.

By the end of this lesson, learners should be able to

  1. Define data as facts gathered in quantitative or descriptive formats.
  2. Collect real-life personal attributes such as ages, heights, sibling counts, and shoe sizes from classmates.
  3. Record and classify peer attributes including body masses, preferred subjects, birth months, and test scores.

Key vocabulary

Data
Facts gathered as numbers or observations to analyse real-world situations systematically.
The recorded heights of ten Grade 10 students formed our statistical data set.
Numerical data
Information expressed using numbers obtained through counting items or measuring physical quantities.
Noting down learners' ages in completed years provides numerical data for class analysis.
Categorical data
Information classified into non-numerical categories or descriptive labels such as months.
Grouping learners by their birth month creates categorical data for summary charts.
Frequency
The total number of times a specific value or category occurs within data.
The frequency of learners preferring Mathematics in our sample survey was eight.

Lesson preview

Slide 1 · Collecting Practical Numerical Data from ClassmatesOpening · 18 min
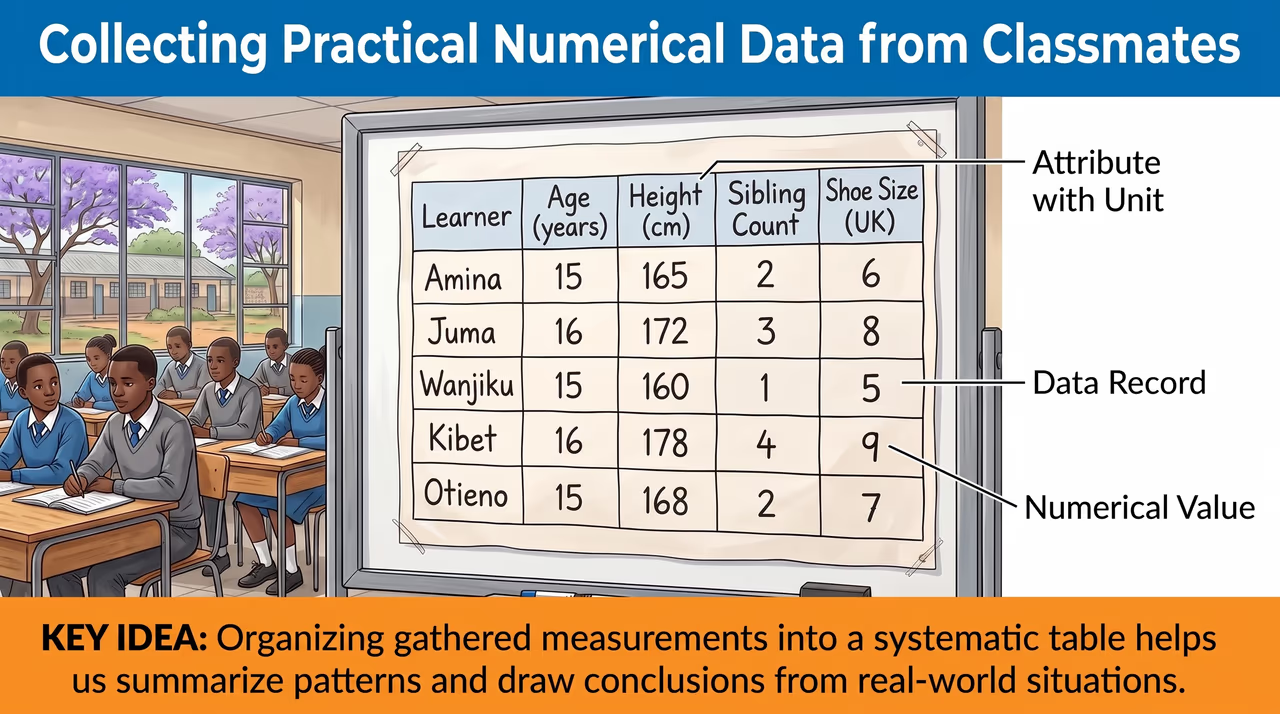
A classroom board displays a data table recording the ages, heights, sibling counts, and shoe sizes of five learners.
Figure 1: A classroom board displays a data table recording the ages, heights, sibling counts, and shoe sizes of five learners.

In statistics, data represents factual measurements gathered to help us analyse real-world situations systematically. When gathering statistics from everyday contexts, such as measuring physical attributes or recording household figures, we obtain values like heights, ages, shoe sizes, or family sizes. Organising these numbers into systematic tally tables allows us to summarise patterns, draw meaningful conclusions, and make informed decisions about our immediate environment.

  • Data refers to facts or measurements gathered in quantitative or qualitative form for analysis.
  • Gathering statistics from everyday contexts provides realistic measurements for secondary mathematical study.
  • Values such as heights in centimetres and ages in completed years represent quantitative observations.
  • Recording classmate statistics in systematic tables makes raw numerical figures easy to interpret.
Worked example. Sum all recorded heights: 154+160+158+165+154+161=952 cm. Count the total number of learners in the sample group, which is 6. Divide the total height by the number of learners: 9526≈158.67 cm. Answer: The mean height of the group is approximately 158.67 cm..

Check question: Four learners recorded their shoe sizes as 38, 40, 41, and 37. What is the mean shoe size for these four learners?

  1. 39
  2. 40.5
  3. 52
  4. 156
Show answer

39. First, sum the four shoe sizes: 38+40+41+37=156. Then, divide the sum by the number of learners (4): 1564=39.

Slide 2 · Gathering Categorical and Performance DataPractice · 22 min
A data summary grid on a whiteboard displays learner identifiers alongside their mass, favourite subject, birth month, and mathematics score (%).
Figure 2: A data summary grid on a whiteboard displays learner identifiers alongside their mass, favourite subject, birth month, and mathematics score (%).

Teach the full lesson on the projector

This lesson, and every other Grade 1–10 CBE lesson, comes ready to project with the EAP ClassKit. It runs without electricity or internet.

  • Both slides with diagrams and class activities
  • Teacher notes, SNE adaptations and assessment checks
  • Homework and the other 15 lessons in this sub-strand

All 16 lessons in Statistics I

  1. 1Gathering Data from Practical SituationsCollect data from real-life sources
  2. 2Frequency Distribution Tables for Ungrouped and Grouped DataDraw a frequency distribution table for grouped and ungrouped data
  3. 3Drawing Grouped Frequency Distribution TablesDraw a frequency distribution table for grouped and ungrouped data
  4. 4Constructing Frequency Distribution Tables for Grouped and Ungrouped DataDraw a frequency distribution table for grouped and ungrouped data
  5. 5Calculating Averages and Middle Values of Raw DataDetermine mean, mode and median of grouped and ungrouped data
  6. 6Determining Median of Data and Introduction to Grouped Data MeanDetermine mean, mode and median of grouped and ungrouped data
  7. 7Determining Mean, Modal Class, and Median of Grouped DataDetermine mean, mode and median of grouped and ungrouped data
  8. 8Determining Mean, Mode, and Median of Grouped and Ungrouped DataDetermine mean, mode and median of grouped and ungrouped data
  9. 9Representing Data Using Histograms and Frequency PolygonsRepresent data using histograms and frequency polygons
  10. 10Constructing Histograms and Frequency PolygonsRepresent data using histograms and frequency polygons
  11. 11Advanced Data Representation: Histograms and Frequency PolygonsRepresent data using histograms and frequency polygons
  12. 12Interpreting Data from Histograms and Frequency PolygonsInterpret data from histograms and frequency polygons
  13. 13Interpreting Histograms and Frequency PolygonsInterpret data from histograms and frequency polygons
  14. 14Interpreting Histograms and Frequency PolygonsInterpret data from histograms and frequency polygons
  15. 15Data Collection, Organisation, and Informed Decision MakingPromote data collection, organisation and representation for informed decision making
  16. 16Data Interpretation and Decision MakingPromote data collection, organisation and representation for informed decision making