
Skip to content

Grade 10 · Core Mathematics · Lesson 7 of 16

Determining Mean, Modal Class, and Median of Grouped Data

A Grade 10 Core Mathematics CBE lesson from the sub-strand Statistics I. In it, learners calculate the mean of grouped data using class mid-points and frequency products.

Strand Statistics and ProbabilitySub-strand Statistics ILesson code 10CM-31-L740 minutes · 4 slides

KICD learning outcome (c)

Determine mean, mode and median of grouped and ungrouped data.

By the end of this lesson, learners should be able to

  1. Calculate the mean of grouped data using class mid-points and frequency products.
  2. Identify the modal class of grouped data from a frequency distribution table.
  3. Locate the median class using cumulative frequency and compute the grouped median using the linear interpolation formula.

Key vocabulary

Modal class
The class interval that has the highest frequency in a grouped frequency table.
In the tea leaf harvest data, the modal class is 30 to 39 kilograms.
Mid-point
The middle value of a class interval found by adding limits and dividing by two.
The mid-point for the class interval 10 to 19 is 14.5 kilograms.
Cumulative frequency
The running total of frequencies added progressively from the first class interval down.
The cumulative frequency for the second seedling class reaches 23 total plants.
Median class
The class interval containing the middle value when cumulative frequency reaches half total data.
Since half of 50 is 25, the median class is 15 to 19.
Lower class boundary
The exact boundary value separating a class interval from the preceding adjacent interval.
The lower class boundary for the interval 140 to 149 is 139.5.
Class width
The difference between upper and lower class boundaries for a given class interval.
Subtracting 139.5 from 149.5 gives a class width of 10 units.
Grouped mean
An estimate of the arithmetic mean obtained using class mid-points and frequencies.
Dividing the total product sum 1200 by 40 yields a grouped mean of 30.

Lesson preview

Slide 1 · Mean and Modal Class of Grouped DataOpening · 10 min
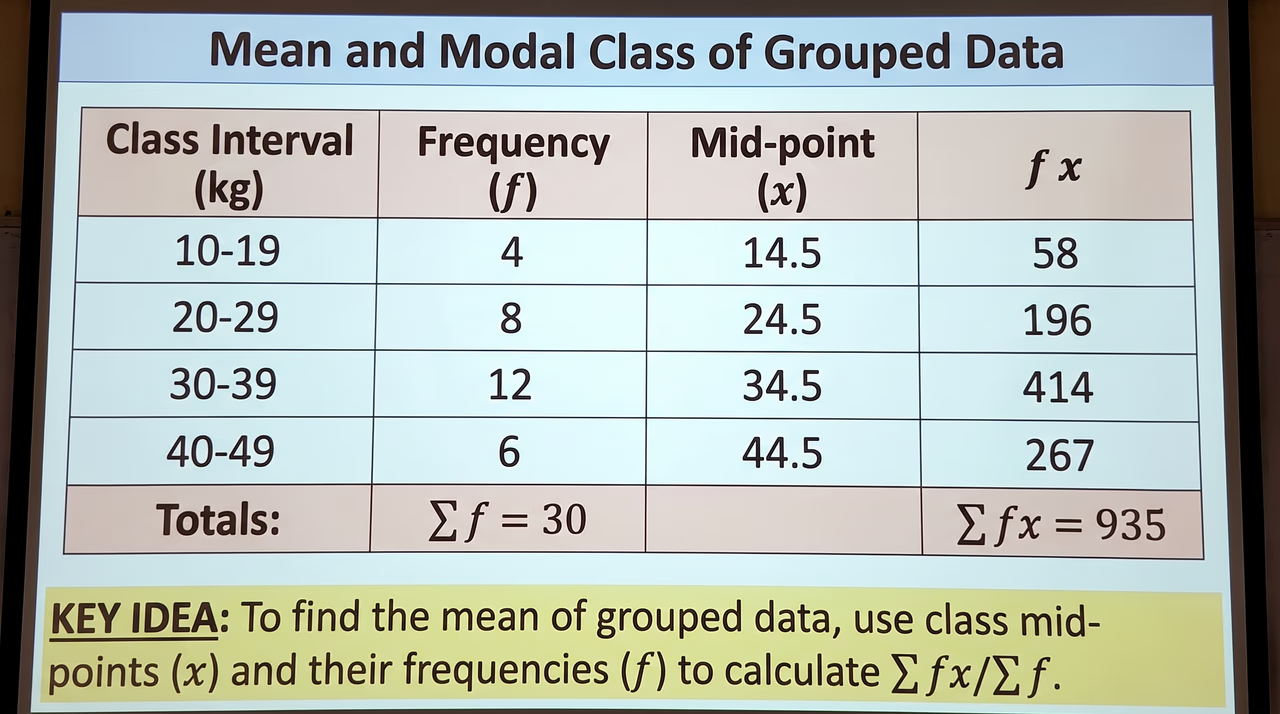
This frequency table displays class intervals, frequencies, mid-points, and their products for grouped data.
Figure 1: This frequency table displays class intervals, frequencies, mid-points, and their products for grouped data.

When statistical data is presented in grouped class intervals, exact raw values are not available. To find the mean, we represent each class by its mid-point x, compute the product of frequency f and mid-point x, sum these products ∑fx, and divide by total frequency ∑f. The modal class is simply the class interval containing the highest frequency. Refer to Figure 1 for an example of calculating the sum of frequencies and their products.

  • To estimate the mean of grouped data, multiply each class mid-point by its corresponding class frequency.
  • Sum all fx products and divide by the total number of data values ∑f.
  • The modal class is identified simply as the class interval with the largest frequency value.
  • Using class mid-points assumes data values are evenly distributed across each class interval.
Worked example. Step 1: Calculate class mid-points (x): 10-19 is 10+192=14.5; 20-29 is 24.5; 30-39 is 34.5; 40-49 is 44.5. Step 2: Calculate fx products: 4×14.5=58, 8×24.5=196, 12×34.5=414, 6×44.5=267. Step 3: Sum frequencies ∑f=4+8+12+6=30 and sum products ∑fx=58+196+414+267=935. Step 4: Compute mean Mean=∑fx∑f=93530=31.17 kg (2 d.p.). Step 5: Identify modal class: highest frequency is 12, so modal class is 30 - 39 kg. Answer: Grouped mean = 31.17 kg; Modal class = 30 - 39 kg..

Check question: A baker records the number of loaves made daily over 20 days: 10 - 19 loaves (f=3), 20 - 29 loaves (f=5), 30 - 39 loaves (f=8), 40 - 49 loaves (f=4). Calculate the mean number of daily loaves produced and state the modal class.

  1. Mean = 31 loaves; Modal class = 30 - 39 loaves
  2. Mean = 29.5 loaves; Modal class = 30 - 39 loaves
  3. Mean = 26.5 loaves; Modal class = 30 - 39 loaves
  4. Mean = 31 loaves; Modal class = 8
Show answer

Mean = 31 loaves; Modal class = 30 - 39 loaves. The mid-points (x) are 14.5, 24.5, 34.5, and 44.5. The products fx are 3×14.5=43.5, 5×24.5=122.5, 8×34.5=276, and 4×44.5=178. The sum ∑fx=620. The mean is 620÷20=31 loaves. The highest frequency is 8, so the modal class is 30 - 39 loaves.

Slide 2 · Locating the Median Class using Cumulative FrequencyModel · 10 min
A cumulative frequency table illustrates how to identify the median class for grouped seedling lengths.
Figure 2: A cumulative frequency table illustrates how to identify the median class for grouped seedling lengths.

Teach the full lesson on the projector

This lesson, and every other Grade 1–10 CBE lesson, comes ready to project with the EAP ClassKit. It runs without electricity or internet.

  • All 4 slides with diagrams and class activities
  • Teacher notes, SNE adaptations and assessment checks
  • Homework and the other 15 lessons in this sub-strand

All 16 lessons in Statistics I

  1. 1Gathering Data from Practical SituationsCollect data from real-life sources
  2. 2Frequency Distribution Tables for Ungrouped and Grouped DataDraw a frequency distribution table for grouped and ungrouped data
  3. 3Drawing Grouped Frequency Distribution TablesDraw a frequency distribution table for grouped and ungrouped data
  4. 4Constructing Frequency Distribution Tables for Grouped and Ungrouped DataDraw a frequency distribution table for grouped and ungrouped data
  5. 5Calculating Averages and Middle Values of Raw DataDetermine mean, mode and median of grouped and ungrouped data
  6. 6Determining Median of Data and Introduction to Grouped Data MeanDetermine mean, mode and median of grouped and ungrouped data
  7. 7Determining Mean, Modal Class, and Median of Grouped DataDetermine mean, mode and median of grouped and ungrouped data
  8. 8Determining Mean, Mode, and Median of Grouped and Ungrouped DataDetermine mean, mode and median of grouped and ungrouped data
  9. 9Representing Data Using Histograms and Frequency PolygonsRepresent data using histograms and frequency polygons
  10. 10Constructing Histograms and Frequency PolygonsRepresent data using histograms and frequency polygons
  11. 11Advanced Data Representation: Histograms and Frequency PolygonsRepresent data using histograms and frequency polygons
  12. 12Interpreting Data from Histograms and Frequency PolygonsInterpret data from histograms and frequency polygons
  13. 13Interpreting Histograms and Frequency PolygonsInterpret data from histograms and frequency polygons
  14. 14Interpreting Histograms and Frequency PolygonsInterpret data from histograms and frequency polygons
  15. 15Data Collection, Organisation, and Informed Decision MakingPromote data collection, organisation and representation for informed decision making
  16. 16Data Interpretation and Decision MakingPromote data collection, organisation and representation for informed decision making