
Skip to content

Grade 10 · Core Mathematics · Lesson 5 of 16

Calculating Averages and Middle Values of Raw Data

A Grade 10 Core Mathematics CBE lesson from the sub-strand Statistics I. In it, learners calculate the mean of ungrouped data from raw lists and frequency tables.

Strand Statistics and ProbabilitySub-strand Statistics ILesson code 10CM-31-L540 minutes · 4 slides

KICD learning outcome (c)

Determine mean, mode and median of grouped and ungrouped data.

By the end of this lesson, learners should be able to

  1. Calculate the mean of ungrouped data from raw lists and frequency tables.
  2. Identify the mode of ungrouped datasets.
  3. Determine the median of an ungrouped dataset with an odd number of items.

Key vocabulary

Mean
The average value calculated by dividing total sum by total number of items.
The mean daily harvest of green tea leaves was calculated as twenty-six kilograms.
Mode
The specific observation or value that occurs most frequently within a dataset.
The mode of the harvested daily tea masses was twenty-four kilograms.
Frequency table
A table showing each data item paired with its corresponding number of occurrences.
The frequency table recorded how many avocadoes were bought by twenty market customers.
Median
The middle value of a dataset when arranged in ascending or descending order.
The median number of bread loaves sold across nine days was thirty loaves.
Central tendency
A single central value that summarises a entire set of statistical observations.
The mean and median represent key central statistics for workshop daily wages.

Lesson preview

Slide 1 · Introduction to Mean and Mode for Unorganised DataOpening · 10 min
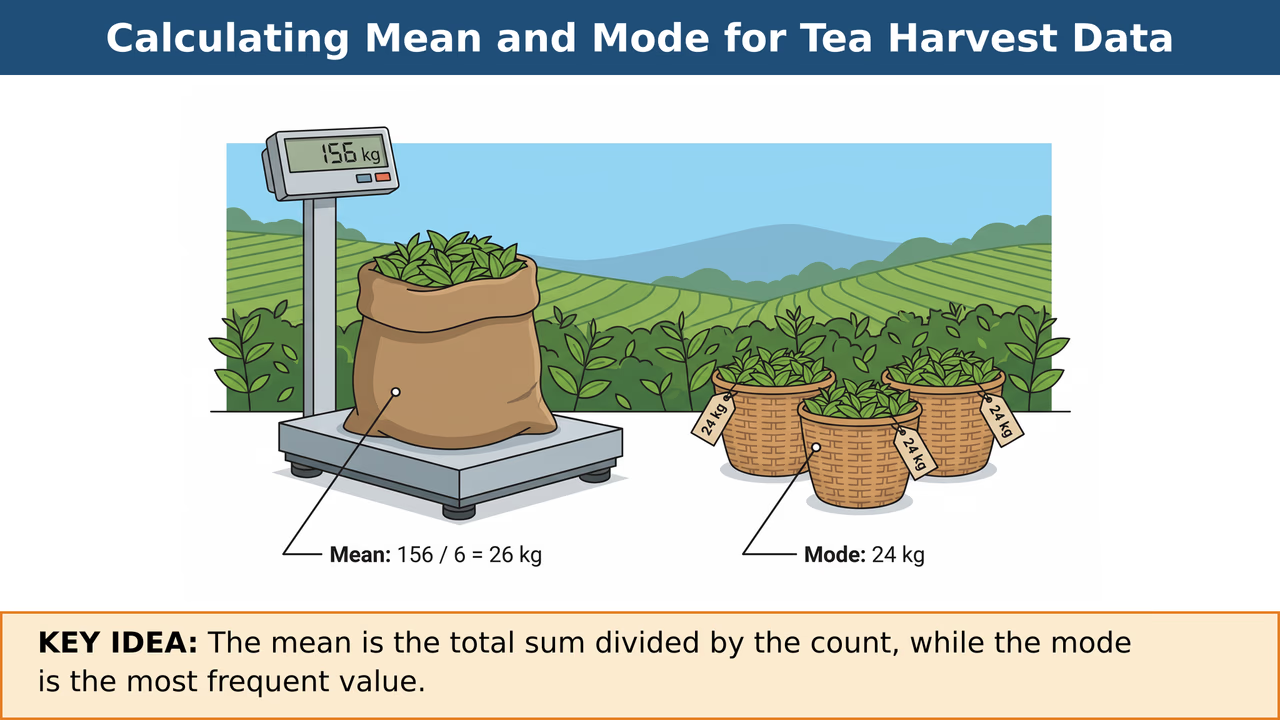
A large sack on a weighing scale shows the total harvest weight, while three smaller identical baskets represent the mode.
Figure 1: A large sack on a weighing scale shows the total harvest weight, while three smaller identical baskets represent the mode.

In statistics, central position indicators describe a typical value within a collection of observations. For raw, unorganised statistics, the mean is calculated by finding the total sum of all items and dividing it by the total number of items. The mode is simply the item that occurs with the greatest frequency. These summary measures help us quickly interpret real-life data gathered from daily activities such as farming, trade, and sporting events.

  • The mean is calculated by summing all data values and dividing by the total count.
  • The mode is the value that appears most frequently in a given dataset.
  • Ungrouped data consists of individual raw numerical observations before organisation into groups.
  • A dataset can have one mode, more than one mode, or no mode at all.
Worked example. Sum the daily mass values: 24+28+24+30+24+26=156 kg. Count the total number of days: n=6. Calculate mean: Mean=1566=26 kg. Identify the most frequent value: 24 occurs 3 times, so the mode is 24 kg. Answer: Mean = 26 kg, Mode = 24 kg.

Check question: A boda boda rider collected the following fares in Kenyan Shillings over 5 trips: 150,200,150,180,220. What is the mean fare?

  1. KSh 150
  2. KSh 180
  3. KSh 225
  4. KSh 900
Show answer

KSh 180. The mean is found by calculating the total sum of the fares and dividing by the number of trips. The sum of the fares is 150+200+150+180+220=900. Dividing by 5 trips gives 900÷5=180 Kenyan Shillings.

Slide 2 · Mean and Mode from Frequency Tally TablesModel · 10 min
A frequency table organises the number of avocados and their frequencies to calculate the total sum of products.
Figure 2: A frequency table organises the number of avocados and their frequencies to calculate the total sum of products.

Teach the full lesson on the projector

This lesson, and every other Grade 1–10 CBE lesson, comes ready to project with the EAP ClassKit. It runs without electricity or internet.

  • All 4 slides with diagrams and class activities
  • Teacher notes, SNE adaptations and assessment checks
  • Homework and the other 15 lessons in this sub-strand

All 16 lessons in Statistics I

  1. 1Gathering Data from Practical SituationsCollect data from real-life sources
  2. 2Frequency Distribution Tables for Ungrouped and Grouped DataDraw a frequency distribution table for grouped and ungrouped data
  3. 3Drawing Grouped Frequency Distribution TablesDraw a frequency distribution table for grouped and ungrouped data
  4. 4Constructing Frequency Distribution Tables for Grouped and Ungrouped DataDraw a frequency distribution table for grouped and ungrouped data
  5. 5Calculating Averages and Middle Values of Raw DataDetermine mean, mode and median of grouped and ungrouped data
  6. 6Determining Median of Data and Introduction to Grouped Data MeanDetermine mean, mode and median of grouped and ungrouped data
  7. 7Determining Mean, Modal Class, and Median of Grouped DataDetermine mean, mode and median of grouped and ungrouped data
  8. 8Determining Mean, Mode, and Median of Grouped and Ungrouped DataDetermine mean, mode and median of grouped and ungrouped data
  9. 9Representing Data Using Histograms and Frequency PolygonsRepresent data using histograms and frequency polygons
  10. 10Constructing Histograms and Frequency PolygonsRepresent data using histograms and frequency polygons
  11. 11Advanced Data Representation: Histograms and Frequency PolygonsRepresent data using histograms and frequency polygons
  12. 12Interpreting Data from Histograms and Frequency PolygonsInterpret data from histograms and frequency polygons
  13. 13Interpreting Histograms and Frequency PolygonsInterpret data from histograms and frequency polygons
  14. 14Interpreting Histograms and Frequency PolygonsInterpret data from histograms and frequency polygons
  15. 15Data Collection, Organisation, and Informed Decision MakingPromote data collection, organisation and representation for informed decision making
  16. 16Data Interpretation and Decision MakingPromote data collection, organisation and representation for informed decision making