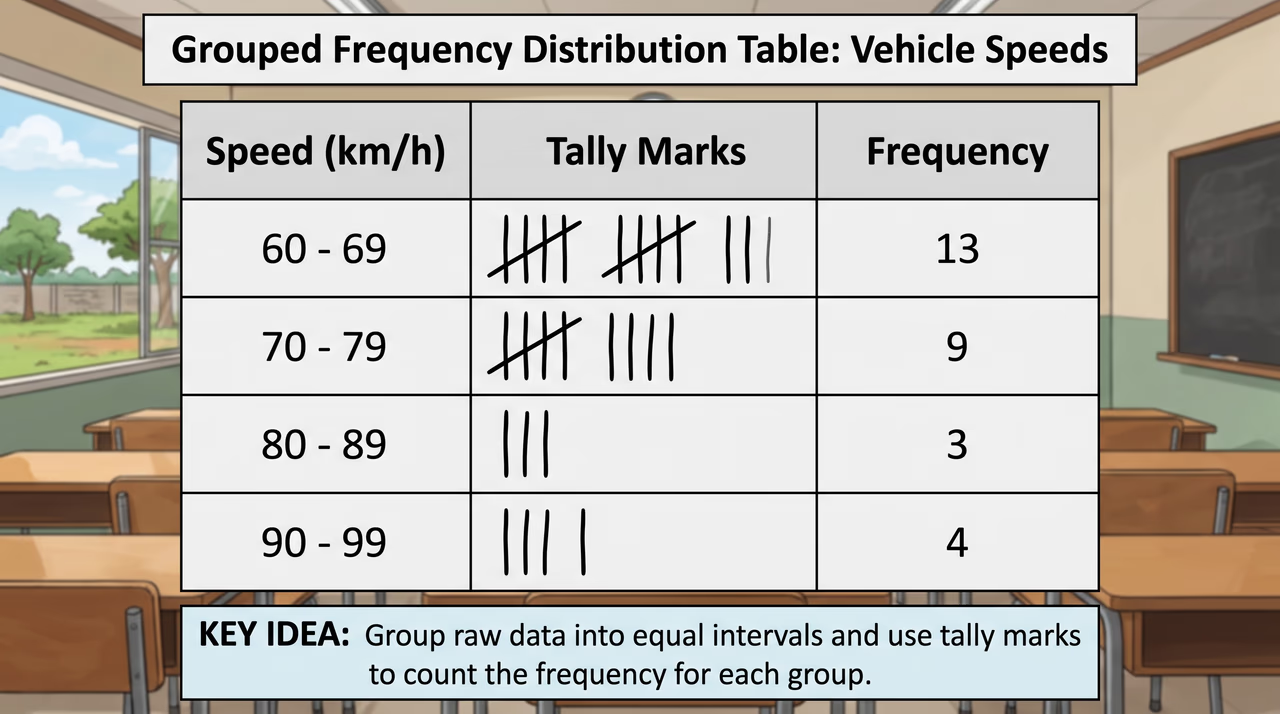
When summarising discrete data with few unique values, we use an ungrouped frequency distribution table. The table consists of three main columns: the variable value, tally marks, and the frequency . Tallies are written in groups of five using four vertical strokes and one diagonal cross-stroke. Counting the tallies yields the exact frequency of each raw score, providing a clear visual summary of the entire collection. Use Figure 1 to identify the three main columns used in an ungrouped frequency table.
- Ungrouped frequency distribution tables organise distinct discrete data values without grouping them into ranges.
- A tally column uses vertical stroke marks to count how many times each raw score appears.
- The frequency represents the total count of tally marks for a specific individual score.
- Summing all frequencies in the table gives the total number of observations in the dataset.
Check question: In a survey of 16 families, the number of pets per family is recorded as: 0, 1, 2, 1, 0, 3, 2, 1, 1, 0, 2, 1, 3, 1, 2, 1. What is the frequency of families having exactly 1 pet?
- 3
- 4
- 7
- 8
Show answer
7. To find the frequency of families with exactly 1 pet, tally the number of times 1 appears in the dataset. The occurrences are at the 2nd, 4th, 8th, 9th, 12th, 14th, and 16th positions. Counting the occurrences of the number 1 gives a total frequency of 7.