Slide 1 · Grouping Raw Data into Class IntervalsOpening · 12 min

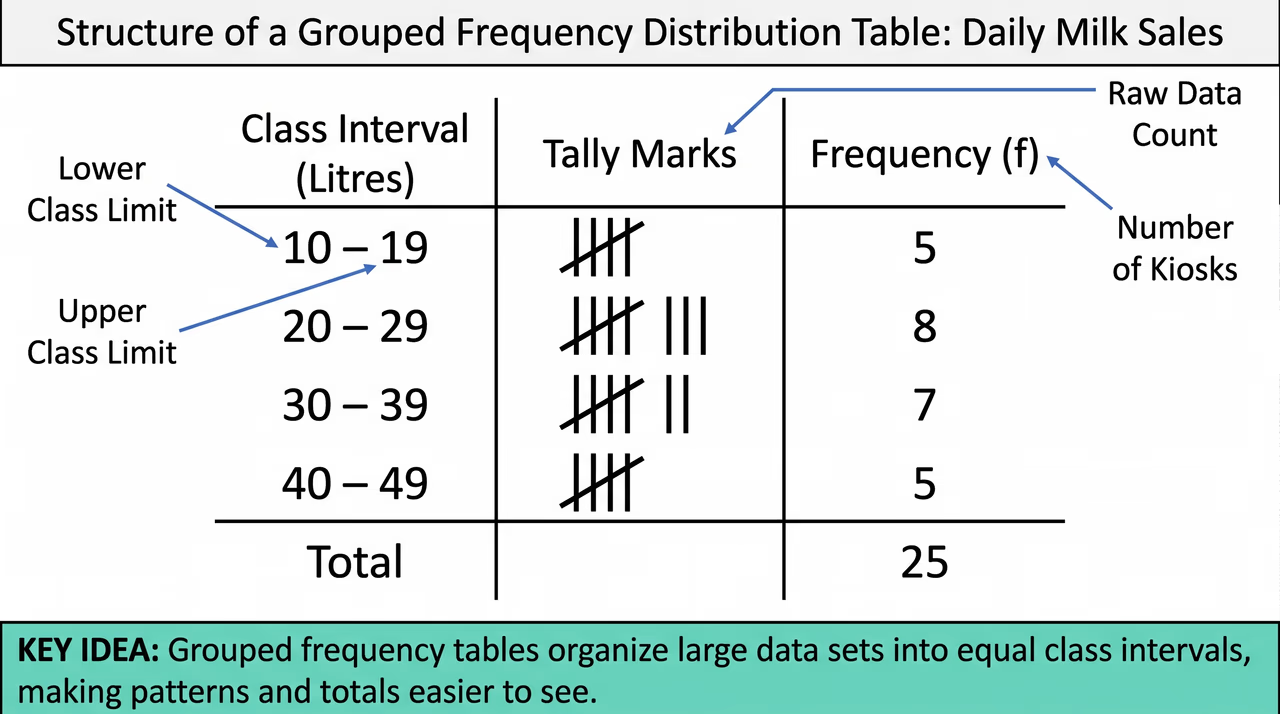
When working with large data sets with wide numerical ranges, listing individual values is inefficient. Instead, we divide the range into equal groups called class intervals. For example, counting damaged fruits in 30 baskets produces many different numbers. Grouping these counts into equal non-overlapping intervals, such as 5–9 or 10–14, helps us organise raw statistics into a clean structure for clear analysis. Use Figure 1 to see how the raw numbers are grouped into four class intervals.
- Grouping data combines large sets of numbers into clear non-overlapping class intervals.
- Every numerical value in the dataset must belong to exactly one class group.
- Class intervals should have equal width to allow fair comparison across groups.
- Tally marks are used to count items falling within each class interval accurately.
Worked example. Identify all numbers from 5 to 9 inclusive in the dataset: 6, 8, 7, 9, 5, 8, 9, 6, 7. Count the identified values: there are 9 occurrences. Record the total count as the frequency for the class 5–9. Answer: The class 5–9 has a frequency of 9..
Check question: How many baskets contained between 15 and 19 damaged passion fruits inclusive?
- 4
- 5
- 8
- 9
Show answer
8. The raw data values falling in the class interval 15–19 are 15, 19, 18, 16, 17, 19, 15, and 18. When we count these values, we find there are 8 baskets.