Skip to content

Grade 10 · Core Mathematics · Lesson 6 of 16

Determining Median of Data and Introduction to Grouped Data Mean

A Grade 10 Core Mathematics CBE lesson from the sub-strand Statistics I. In it, learners determine the median of raw datasets with odd and even numbers of items.

Strand Statistics and ProbabilitySub-strand Statistics ILesson code 10CM-31-L640 minutes · 4 slides

KICD learning outcome (c)

Determine mean, mode and median of grouped and ungrouped data.

By the end of this lesson, learners should be able to

  1. Determine the median of raw datasets with odd and even numbers of items.
  2. Calculate the median from ungrouped frequency tables using cumulative frequency.
  3. Compute mean, mode, and median from ungrouped frequency distribution tables.
  4. Construct grouped frequency table columns for class midpoints x and fx to determine the mean of grouped data.

Key vocabulary

Median
middle value in a dataset when numbers are ordered from smallest to largest.
The median of the ordered scores five, seven, and nine is seven.
Cumulative frequency
running total of frequencies calculated by adding each frequency to the previous total.
The cumulative frequency reaching eight identifies the location of the median test score.
Frequency distribution
tabular arrangement showing how often each data value or interval occurs in data.
The frequency distribution displays student scores and how many learners achieved each score.
Class midpoint
average of the lower and upper boundaries of a given data class interval.
The class midpoint for interval ten to nineteen is calculated as fourteen point five.

Lesson preview

Slide 1 · Median of Raw Data (Odd vs. Even Datasets)Opening · 10 min
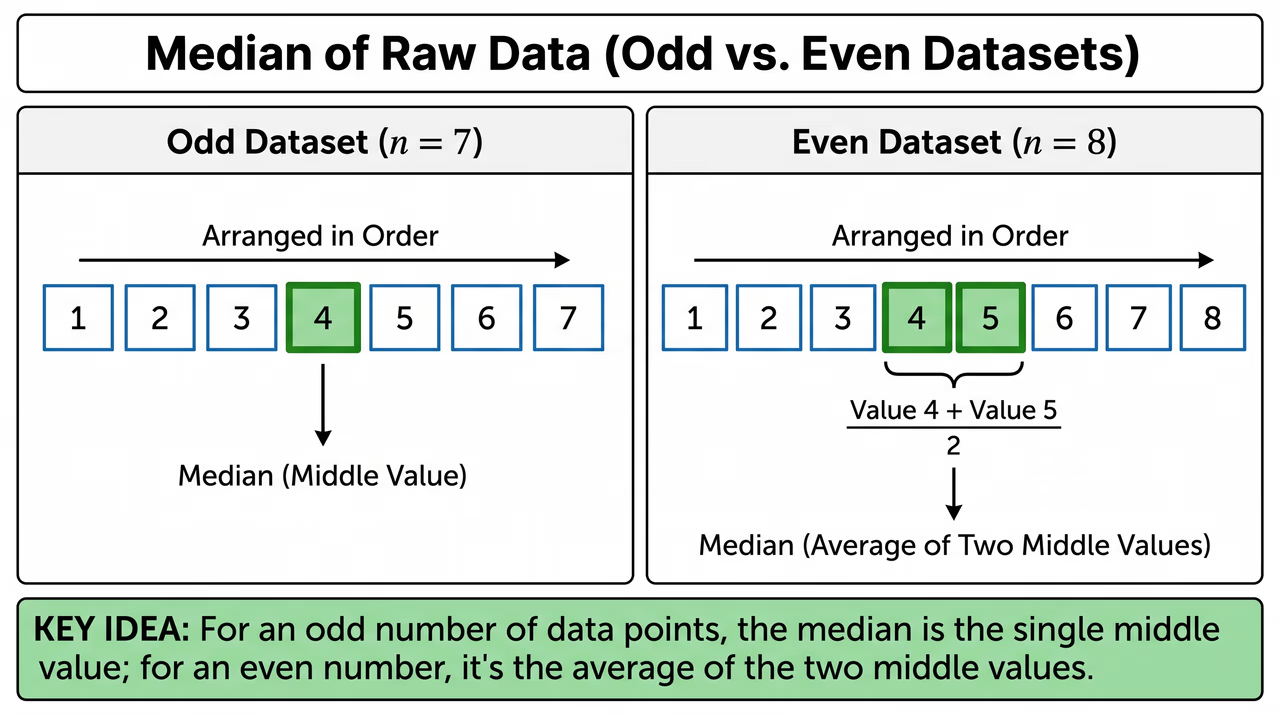
This diagram illustrates finding the median for an odd dataset by picking the middle value, and for an even dataset by averaging the two middle values.
Figure 1: This diagram illustrates finding the median for an odd dataset by picking the middle value, and for an even dataset by averaging the two middle values.

Determining the median requires arranging numerical data in order of magnitude. For instance, when analysing the number of phone calls received by John and Everline per day in 7 and 10 days respectively, we deal with odd and even datasets. When a dataset contains an odd number of observations (7 days), the median is the exact middle value. When it contains an even number of observations (10 days), the median is calculated by finding the mean of the two central numbers. Examine Figure 1 to visualise how to find the median in both odd and even datasets.

  • For an odd number of items, such as phone calls over 7 days, the median is the single middle item.
  • When total items are even, such as phone calls over 10 days, average the two middle items.
  • Always arrange the raw data values in ascending or descending order before determining the middle positions.
  • For an even dataset of size n, locate items at positions n2 and n2+1.
Worked example. Arrange the data in ascending order: 18, 20, 22, 24, 26, 28, 30, 32. Count the total number of items: n=8, which is an even number. Identify the two middle positions: 82=4th position and 82+1=5th position. Locate the values at these positions: 4th value is 24, and 5th value is 26. Calculate the mean of the two middle values: 24+262=25. Answer: The median number of loaves sold is 25..

Check question: Find the median of the raw dataset: 14, 8, 18, 5, 20, 10.

  1. 12
  2. 11.5
  3. 10
  4. 12.5
Show answer

12. Sorting the 6 items in ascending order gives 5, 8, 10, 14, 18, 20. Since n=6 is even, the middle values are at positions 3rd (10) and 4th (14). Their average is 10+142=12.

Slide 2 · Finding Median from Frequency Tables using Cumulative FrequencyModel · 10 min
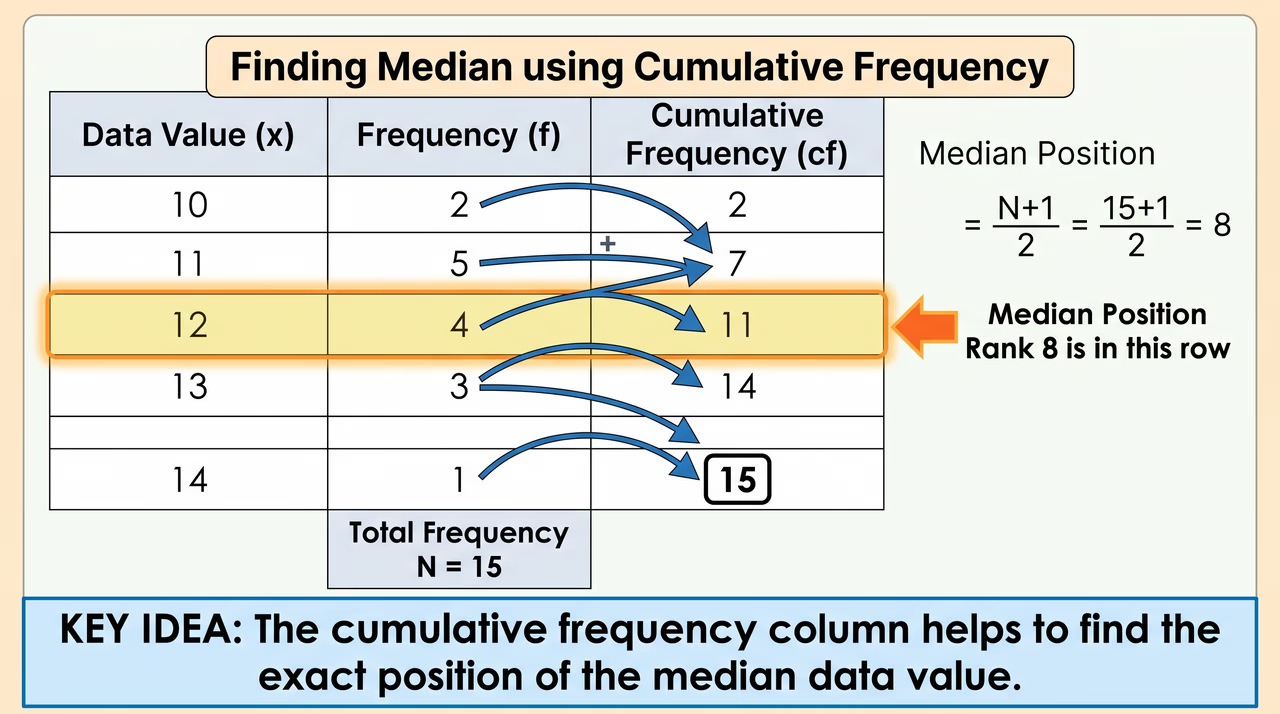
A frequency table demonstrates how to use a cumulative frequency column to locate the median position and find the corresponding data value.
Figure 2: A frequency table demonstrates how to use a cumulative frequency column to locate the median position and find the corresponding data value.

Teach the full lesson on the projector

This lesson, and every other Grade 1–10 CBE lesson, comes ready to project with the EAP ClassKit. It runs without electricity or internet.

  • All 4 slides with diagrams and class activities
  • Teacher notes, SNE adaptations and assessment checks
  • Homework and the other 15 lessons in this sub-strand

All 16 lessons in Statistics I

  1. 1Gathering Data from Practical SituationsCollect data from real-life sources
  2. 2Frequency Distribution Tables for Ungrouped and Grouped DataDraw a frequency distribution table for grouped and ungrouped data
  3. 3Drawing Grouped Frequency Distribution TablesDraw a frequency distribution table for grouped and ungrouped data
  4. 4Constructing Frequency Distribution Tables for Grouped and Ungrouped DataDraw a frequency distribution table for grouped and ungrouped data
  5. 5Calculating Averages and Middle Values of Raw DataDetermine mean, mode and median of grouped and ungrouped data
  6. 6Determining Median of Data and Introduction to Grouped Data MeanDetermine mean, mode and median of grouped and ungrouped data
  7. 7Determining Mean, Modal Class, and Median of Grouped DataDetermine mean, mode and median of grouped and ungrouped data
  8. 8Determining Mean, Mode, and Median of Grouped and Ungrouped DataDetermine mean, mode and median of grouped and ungrouped data
  9. 9Representing Data Using Histograms and Frequency PolygonsRepresent data using histograms and frequency polygons
  10. 10Constructing Histograms and Frequency PolygonsRepresent data using histograms and frequency polygons
  11. 11Advanced Data Representation: Histograms and Frequency PolygonsRepresent data using histograms and frequency polygons
  12. 12Interpreting Data from Histograms and Frequency PolygonsInterpret data from histograms and frequency polygons
  13. 13Interpreting Histograms and Frequency PolygonsInterpret data from histograms and frequency polygons
  14. 14Interpreting Histograms and Frequency PolygonsInterpret data from histograms and frequency polygons
  15. 15Data Collection, Organisation, and Informed Decision MakingPromote data collection, organisation and representation for informed decision making
  16. 16Data Interpretation and Decision MakingPromote data collection, organisation and representation for informed decision making