
Slide 1 · Reading Values and Gradients from a Velocity-Time GraphOpening · 10 min
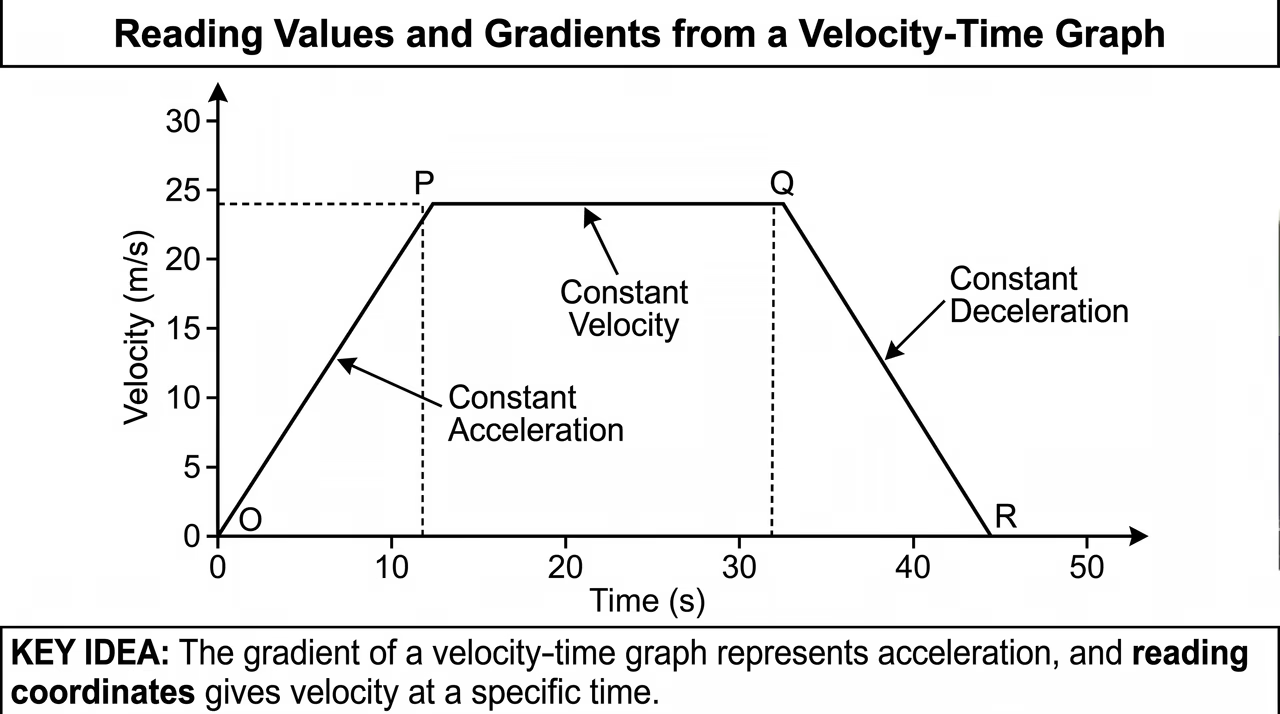
A velocity-time graph displays how speed in a specified direction changes over time. We plot time in seconds along the horizontal axis and velocity in metres per second along the vertical axis. By reading points directly off the curve, we can determine the velocity at a precise instant or find when a specific velocity is reached. Furthermore, calculating the gradient of any straight line section reveals the acceleration over that particular time interval.
- The vertical axis shows velocity in metres per second, while time is plotted on the horizontal axis.
- To find velocity at a given instant, locate time on the horizontal axis and read upwards.
- To find time for a given velocity, locate velocity on the vertical axis and read across.
- The gradient of a line segment represents acceleration, while zero gradient indicates constant velocity.
Worked example. For (a), the line connects to , so . At , . For (b), set in , which gives . For (c), gradient of . Answer: (a) , (b) , (c) .
Check question: Using the van's graph, find the gradient of segment from to and choose the option that correctly states the gradient and its meaning.
- , which represents a deceleration of
- , which represents an acceleration of
- , which represents a deceleration of
- , which represents a constant velocity of
Show answer
, which represents a deceleration of . Gradient . A negative gradient on a velocity-time graph indicates deceleration or retardation.
