
Skip to content

Grade 10 · Core Mathematics · Lesson 14 of 14

Real-Life Applications of Linear Motion

A Grade 10 Core Mathematics CBE lesson from the sub-strand Linear Motion. In it, learners construct and interpret velocity-time graphs for vertical rocket acceleration, missile flight, and car braking efficiency tests.

Strand Measurements and GeometrySub-strand Linear MotionLesson code 10CM-29-L1440 minutes · 3 slides

KICD learning outcome (h)

Appreciate use of linear motion in real-life situations.

By the end of this lesson, learners should be able to

  1. Construct and interpret velocity-time graphs for vertical rocket acceleration, missile flight, and car braking efficiency tests.
  2. Calculate relative speeds and exact meeting clock times for vehicles and runners moving towards each other.
  3. Solve overtaking problems involving delayed departures and extended bodies on parallel tracks.

Key vocabulary

Deceleration
The rate at which an object slows down over a period of time.
A rally car experiences a deceleration of 10 m/s2 when full brakes are applied.
Relative speed
The speed of one object measured with respect to another moving object.
Two approaching vehicles at 70 km/h and 80 km/h have a relative speed of 150 km/h.
Head start
The initial distance lead gained by an object departing before another.
A cyclist leaving one hour earlier gains a 15 km head start over a matatu.

Lesson preview

Slide 1 · Velocity-Time Graphs in Extreme SituationsModel · 12 min
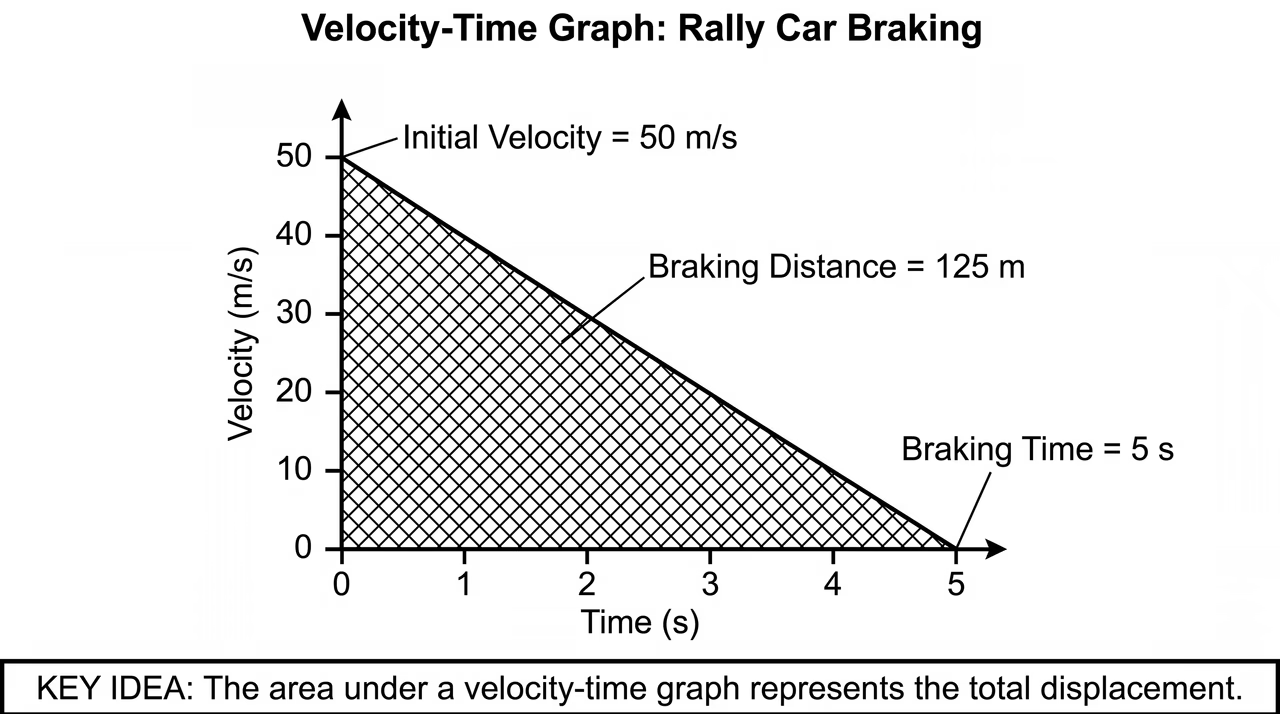
A velocity-time graph for a braking rally car, showing an initial velocity of 50 m/s decreasing to zero over 5 seconds.
Figure 1: A velocity-time graph for a braking rally car, showing an initial velocity of 50 m/s decreasing to zero over 5 seconds.

Velocity-time graphs allow us to analyse complex physical phenomena such as vertical rocket launches, missile or drone test flights, and vehicle braking tests. For vertical acceleration, velocity increases as a rocket ascends skyward. Conversely, applying brakes causes a decrease in velocity down to zero. The area bounded by the graph line and the time axis gives the total distance or altitude gained. Use Figure 1 to see how the area under a braking velocity-time graph gives the total distance.

  • Vertical rocket launches exhibit uniform vertical acceleration represented by an upward-sloping velocity-time line.
  • Braking efficiency tests produce a downward-sloping line as vehicle velocity decreases to zero over time.
  • The vertical axis measures velocity in metres per second while the horizontal axis records time.
  • The geometric area beneath a velocity-time line measures total displacement or height reached during motion.
Worked example. Identify initial velocity u=50 m/s, final velocity v=0 m/s, and time t=5 s. Calculate deceleration: a=v−ut=0−505=−10 m/s2. (Deceleration is 10 m/s2). Calculate distance using the area under the triangular velocity-time graph: Area=12×base×height=12×5×50=125 metres. Answer: Deceleration is 10 m/s2; distance covered during braking is 125 metres. Since 125 m is less than 130 m, the car safely stopped within the limit..

Check question: A weather rocket is launched vertically, reaching a velocity of 300 m/s after 15 seconds of uniform acceleration. What height does it reach during these 15 seconds?

  1. 20 m
  2. 150 m
  3. 2250 m
  4. 4500 m
Show answer

2250 m. The height reached during uniform vertical acceleration is the area of the triangle under the velocity-time graph: 12×base×height=12×15×300=2250 m.

Slide 2 · Relative Speed for Approaching ObjectsPractice · 14 min
A matatu and a car travelling towards each other between Nakuru and Nairobi, showing their combined relative speed.
Figure 2: A matatu and a car travelling towards each other between Nakuru and Nairobi, showing their combined relative speed.

Teach the full lesson on the projector

This lesson, and every other Grade 1–10 CBE lesson, comes ready to project with the EAP ClassKit. It runs without electricity or internet.

  • All 3 slides with diagrams and class activities
  • Teacher notes, SNE adaptations and assessment checks
  • Homework and the other 13 lessons in this sub-strand

All 14 lessons in Linear Motion

  1. 1Distance, Displacement, Speed, Velocity and AccelerationExplain the terms distance, displacement, speed, velocity and acceleration in real-life situations
  2. 2Determining Velocity and AccelerationDetermine velocity and acceleration in different situations
  3. 3Determining Velocity and Acceleration in Different SituationsDetermine velocity and acceleration in different situations
  4. 4Drawing Displacement-Time Graphs in Linear MotionDraw a displacement-time graph of different situations
  5. 5Interpreting Displacement-Time GraphsInterpret displacement-time graph in different situations
  6. 6Interpreting Displacement-Time Graphs in Different SituationsInterpret displacement-time graph in different situations
  7. 7Drawing Velocity-Time Graphs from Data TablesDraw a velocity-time graph from given tables in different situations
  8. 8Drawing Velocity-Time Graphs from Data Tables: Deceleration and ScenariosDraw a velocity-time graph from given tables in different situations
  9. 9Interpreting Velocity-Time Graphs in Linear MotionInterpret velocity-time graph in different situations
  10. 10Interpreting Velocity-Time Graphs in Practical SituationsInterpret velocity-time graph in different situations
  11. 11Relative Speed in Linear MotionDetermine relative speed of two moving bodies in different situations
  12. 12Relative Speed in Linear Motion: Advanced ApplicationsDetermine relative speed of two moving bodies in different situations
  13. 13Appreciating Linear Motion in Real-Life SituationsAppreciate use of linear motion in real-life situations
  14. 14Real-Life Applications of Linear MotionAppreciate use of linear motion in real-life situations