Slide 1 · Introduction to Displacement-Time GraphsOpening · 12 min
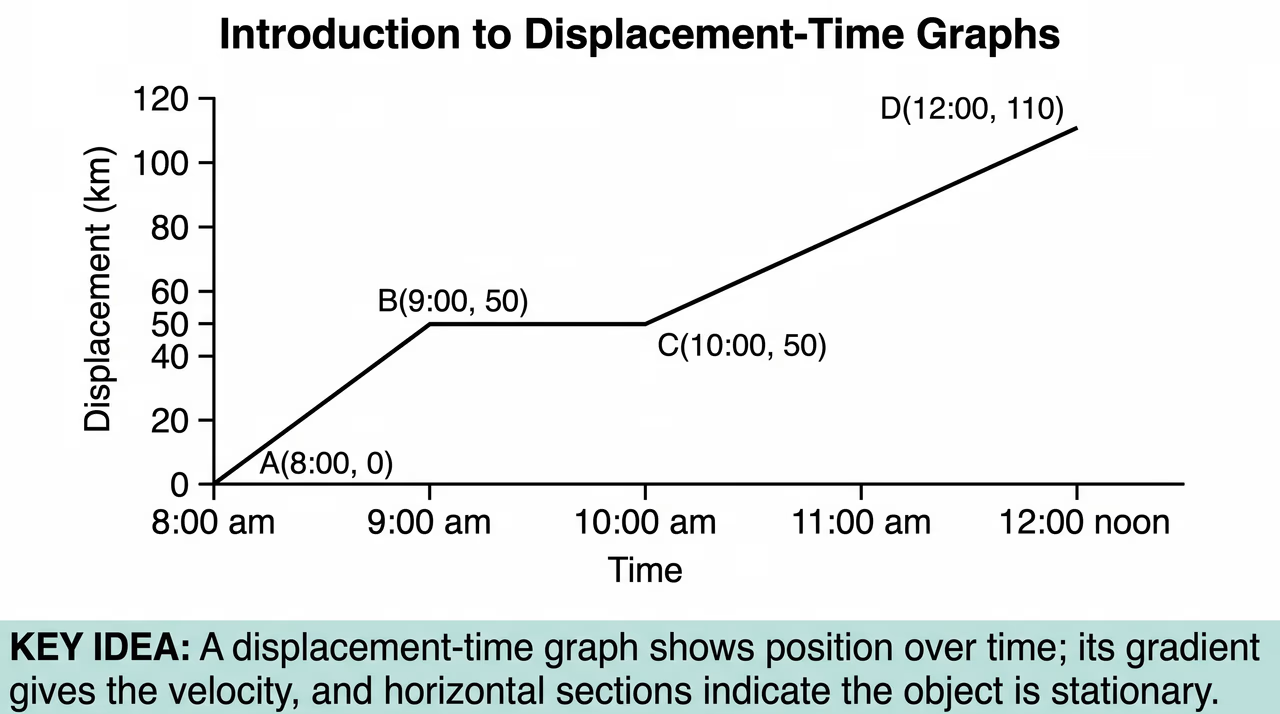
A displacement-time graph shows how far an object has moved from a chosen starting point over time. From this graph, we can directly read the displacement at any given time or determine the precise time corresponding to a specific displacement. Furthermore, calculating the gradient of each straight segment gives the velocity of the object during that time interval. A horizontal line segment indicates that the object is stationary.
- The vertical axis represents displacement from an origin, while the horizontal axis represents time elapsed.
- Direct reading gives the position of a body at any instant or time for a position.
- The gradient of a displacement-time line segment equals the constant velocity during that period.
- A horizontal segment on a displacement-time graph shows zero gradient, meaning the object is at rest.
Worked example. At 9:30 am, time lies on horizontal segment BC where displacement remains constant at 50 km. Segment CD rises from 50 km at 10:00 am to 110 km at 12:00 noon. Velocity on CD is . The velocity on segment CD is , which is below the speed limit. Therefore, the driver acted responsibly. Answer: (a) 50 km, (b) 30 km/h, Yes, the driver acted responsibly.
Check question: From the matatu graph, what is the velocity of the matatu between 8:00 am and 9:00 am (segment AB)?
- 50 km/h
- 50 m/s
- 25 km/h
- 0 km/h
Show answer
50 km/h. Between 8:00 am and 9:00 am (1 hour elapsed), displacement increases from 0 km to 50 km. Velocity = .