Skip to content

Grade 10 · Core Mathematics · Lesson 2 of 12

Empirical Probabilities and Experimental Investigations

A Grade 10 Core Mathematics CBE lesson from the sub-strand Probability 1. In it, learners calculate empirical probabilities from observed discrete data and calendar frequency tables.

Strand Statistics and ProbabilitySub-strand Probability 1Lesson code 10CM-32-L240 minutes · 3 slides

KICD learning outcome (a)

Perform experiments involving probabilities in different situations.

By the end of this lesson, learners should be able to

  1. Calculate empirical probabilities from observed discrete data and calendar frequency tables.
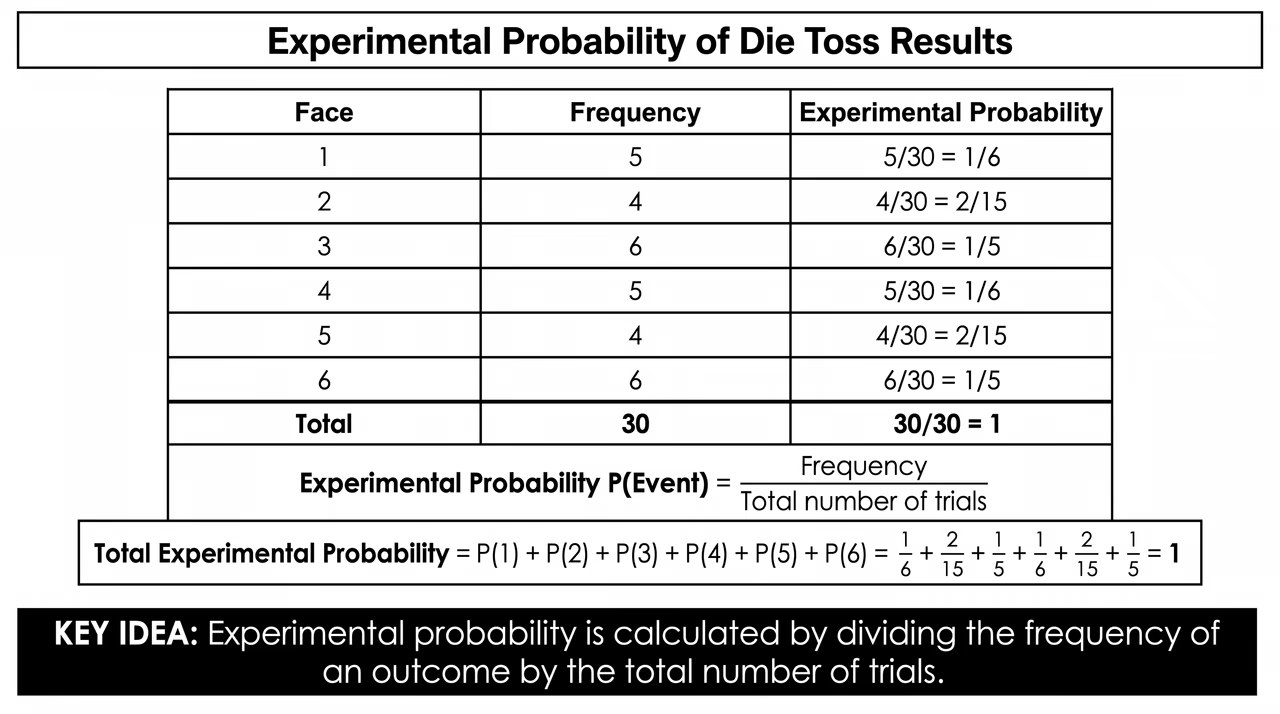
  2. Determine experimental probabilities for coin and die trials and verify that the sum of all outcome probabilities equals one.
  3. Compute experimental probabilities for compound events involving two coins or two dice.

Key vocabulary

Relative Frequency
The proportion of times an event occurs relative to the total number of observed trials.
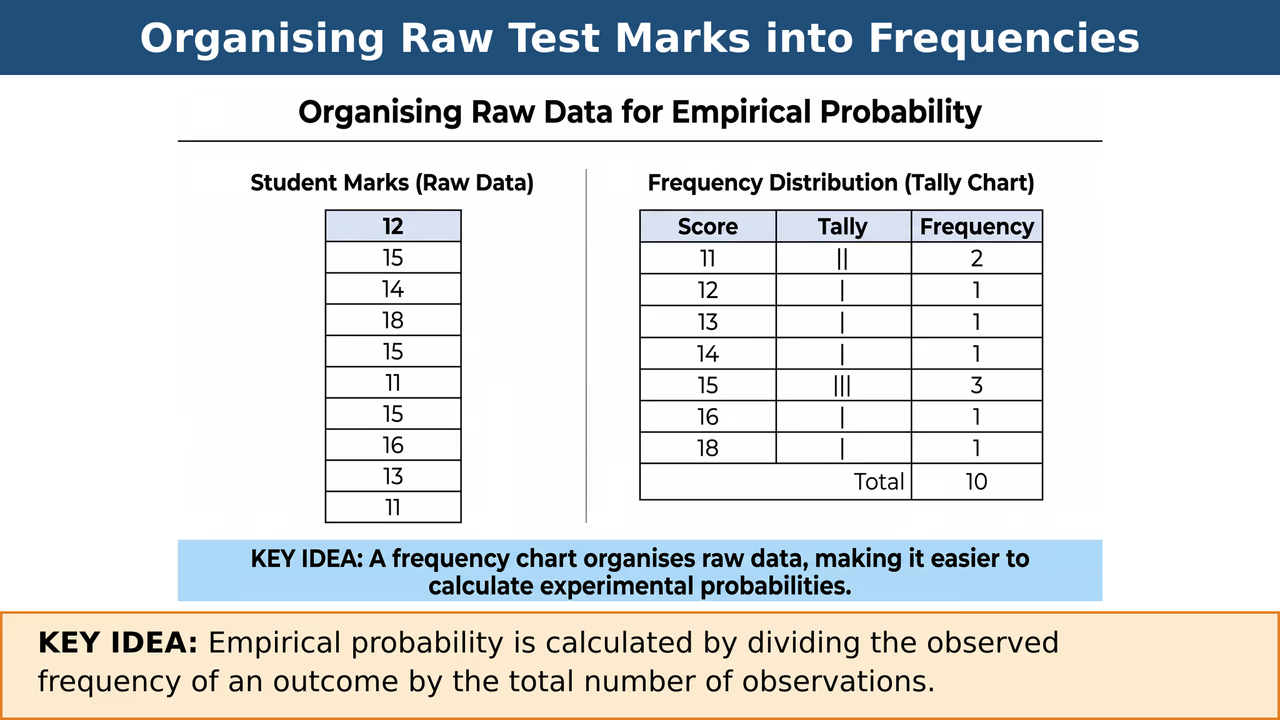
The relative frequency of test marks of at least 15 was five out of ten (510).
Experimental Probability
Probability calculated from actual results obtained by performing a repeated chance experiment.
Rolling face 3 six times in thirty die tosses gives an experimental probability of 630.
Compound Outcome
An outcome resulting from two or more simultaneous or sequential chance experiments.
Rolling two dice and observing a sum of nine is a compound outcome.

Lesson preview

Slide 1 · Empirical Probability from Real-World Observations and Discrete DataOpening · 12 min
A table showing a list of raw student marks alongside a frequency distribution tally chart organising the same data.
Figure 1: A table showing a list of raw student marks alongside a frequency distribution tally chart organising the same data.

Empirical probability measures how often an event occurs based on actual collected data or historical records. When analysing real-world records such as monthly weather patterns, daily equipment usage, or student performance test marks, we calculate experimental probability by dividing the observed count of a specific outcome by the total number of observations. Calculating probabilities for complementary events helps us determine the likelihood of alternative or remaining outcomes in practical contexts. See Figure 1 for an example of how raw student test marks are organised into frequencies.

  • Empirical probability uses real observed frequencies divided by the total number of recorded trials.
  • Weather records allow us to calculate the empirical probability of rainfall for any given calendar month.
  • Raw test scores can be analysed directly to find the probability of a learner scoring a specific mark.
  • The likelihood of an event not occurring is found by subtracting its probability from one.
Worked example. Step 1: Identify total number of observations: N=10. Step 2: Count frequency of score 15: there are 3 students with score 15. Step 3: Calculate P(score=15)=310=0.3. Step 4: Count frequency of scores ≥15: scores are 15, 18, 15, 15, 16 (total 5 students). Step 5: Calculate P(score≥15)=510=12=0.5. Answer: (a) 310=0.3, (b) 12=0.5.

Check question: Over 30 school days, Wanjiku had no ink on 6 days and, on 3 other days, forgot her pen at home. On the remaining days she used her pen. Find the empirical probability that on a randomly selected day she used her pen.

  1. 0.7
  2. 0.3
  3. 0.2
  4. 0.8
Show answer

0.7. Total days = 30. Days pen was not used = 6+3=9. Days pen was used = 30−9=21. Empirical probability = 2130=710=0.7.

Slide 2 · Experimental Probabilities from Repeated Coin and Die TrialsModel · 14 min
A table showing the frequencies and experimental probabilities for thirty rolls of a die, demonstrating that the probabilities sum to one.
Figure 2: A table showing the frequencies and experimental probabilities for thirty rolls of a die, demonstrating that the probabilities sum to one.

Teach the full lesson on the projector

This lesson, and every other Grade 1–10 CBE lesson, comes ready to project with the EAP ClassKit. It runs without electricity or internet.

  • All 3 slides with diagrams and class activities
  • Teacher notes, SNE adaptations and assessment checks
  • Homework and the other 11 lessons in this sub-strand

All 12 lessons in Probability 1

  1. 1Performing Probability Experiments and Finding Experimental ProbabilityPerform experiments involving probabilities in different situations
  2. 2Empirical Probabilities and Experimental InvestigationsPerform experiments involving probabilities in different situations
  3. 3Identifying Range of Probability and Complementary EventsIdentify the range of probability in different situations
  4. 4Generating Probability Space of EventsGenerate probability space of different events
  5. 5Generating Probability Space for Compound EventsGenerate probability space of different events
  6. 6Determining Probability of Mutually Exclusive Events and Introduction to Independent EventsDetermine the probability of mutually exclusive events and independent events
  7. 7Determining Probability of Independent Events and Multi-Stage SelectionsDetermine the probability of mutually exclusive events and independent events
  8. 8Probability Bounds, Complementary Events, and the Addition LawApply the laws of probability in different situations
  9. 9Applying Laws of ProbabilityApply the laws of probability in different situations
  10. 10Determining Probability of Independent Events Using Tree DiagramsDetermine the probability of independent events using tree diagrams
  11. 11Tree Diagrams for Multi-Stage Independent EventsDetermine the probability of independent events using tree diagrams
  12. 12Applications of Probability in Real-Life ContextsAppreciate the application of probability in real-life situations