
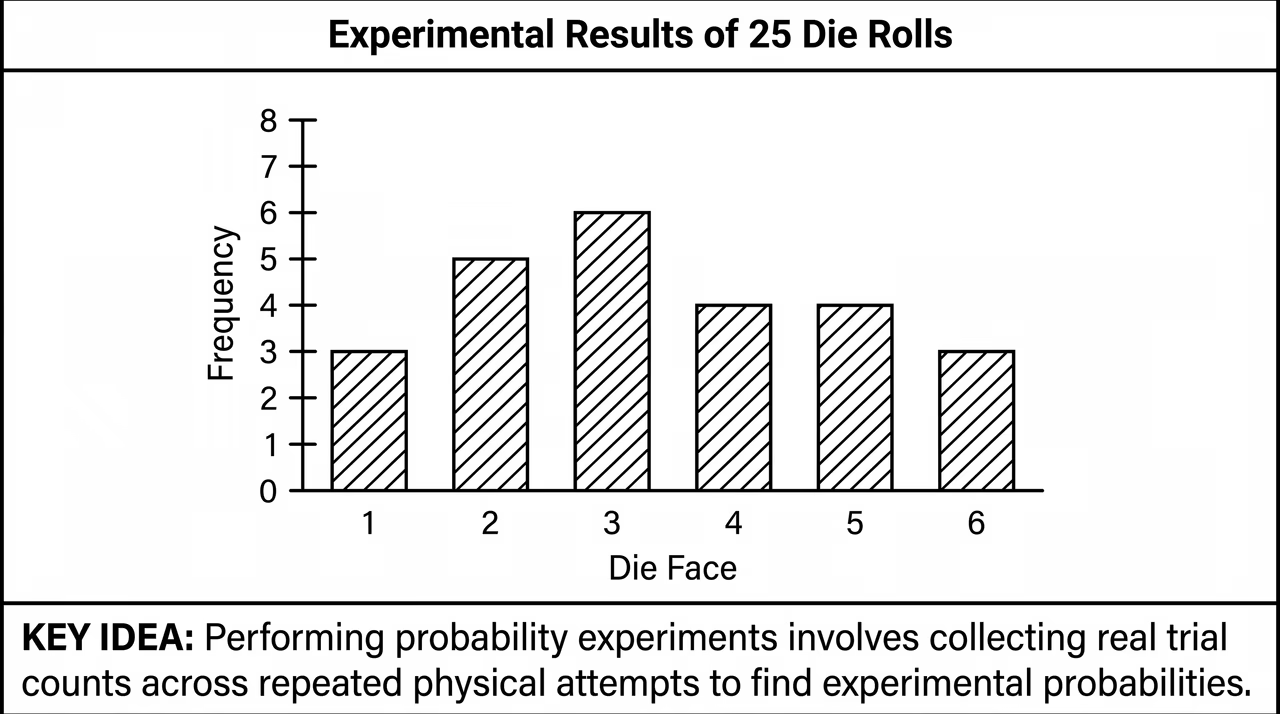
In this intro experiment, we perform practical trials by throwing a standard six-sided die 25 times and recording every outcome. By collecting empirical data across multiple rolls, we tally how frequently each face turns up in a simple summary grid. Dividing the tally count of each outcome by 25 gives its relative frequency. We then compare our observed frequencies with expected theoretical outcomes and analyse differences across various group findings. Use Figure 1 to see how observed frequencies from our trials can be visually summarised.
- Conducting probability experiments allows us to collect real trial counts across repeated physical attempts.
- In our first experiment, we roll a six-sided die 25 times to observe actual outcome frequencies.
- Divide each outcome frequency by 25 to obtain the corresponding relative frequency value.
- Compare observed experimental ratios with expected theoretical values and share findings across different student pairs.
Check question: If a six-sided cube is rolled 25 times and face 6 appears 5 times, what is the relative frequency of face 6?
Show answer
. The relative frequency is obtained by dividing the frequency of the outcome () by the total number of trials (), yielding .
